BOSTON UNIVERSITY

Observations

Working with the world’s great radars, we help gather and interpret the observations that motivate our models and put them to the test.

Radar Observations

Simulation and theory are the core of our group’s work, but they do not stand alone. Throughout our research on the ionosphere and on meteors, we collaborate closely with high-power radar observatories — and occasionally lead observing campaigns of our own — to obtain the measurements that our simulations are designed to explain. Observations tell us what the plasma actually does; our codes and theory tell us why. Keeping the two in close contact is what turns a simulation into science.

Two facilities appear again and again in this work: the 50 MHz Jicamarca Radio Observatory (JRO) in Peru, sitting almost directly beneath the magnetic equator, and the 440 MHz Millstone Hill incoherent scatter radar at MIT’s Haystack Observatory in Massachusetts. Between them they let us study equatorial and mid-latitude plasma physics, meteors, and the enigmatic 150 km echoes.
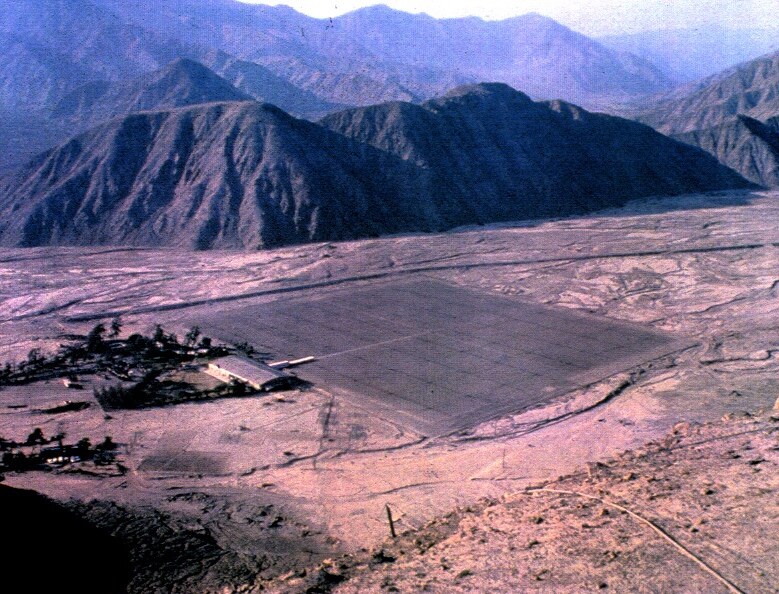
Aerial photograph of the Jicamarca Radio Observatory main antenna array in a desert valley near Lima, Peru.
The 50 MHz Jicamarca Radio Observatory (JRO), Peru. The main array — roughly 300 m on a side and built from thousands of crossed dipoles — is one of the most powerful 50 MHz radars on Earth. Located almost directly under the magnetic equator, it looks nearly perpendicular to the geomagnetic field, the geometry needed to study equatorial electrojet turbulence, 150 km echoes, and non-specular meteor trails. Photo courtesy of the Jicamarca Radio Observatory (IGP).
The Millstone Hill radar antenna at MIT Haystack Observatory.
The 440 MHz Millstone Hill radar, MIT Haystack Observatory, Massachusetts. This UHF incoherent scatter radar — a 68 m fixed zenith antenna together with a 46 m fully steerable dish — measures electron and ion temperatures, densities, and drifts at mid-latitudes, and detects individual meteor head and trail echoes. We use its data to test our meteor plasma models and ISR spectral theory. Photo: Daderot, Wikimedia Commons (public domain).
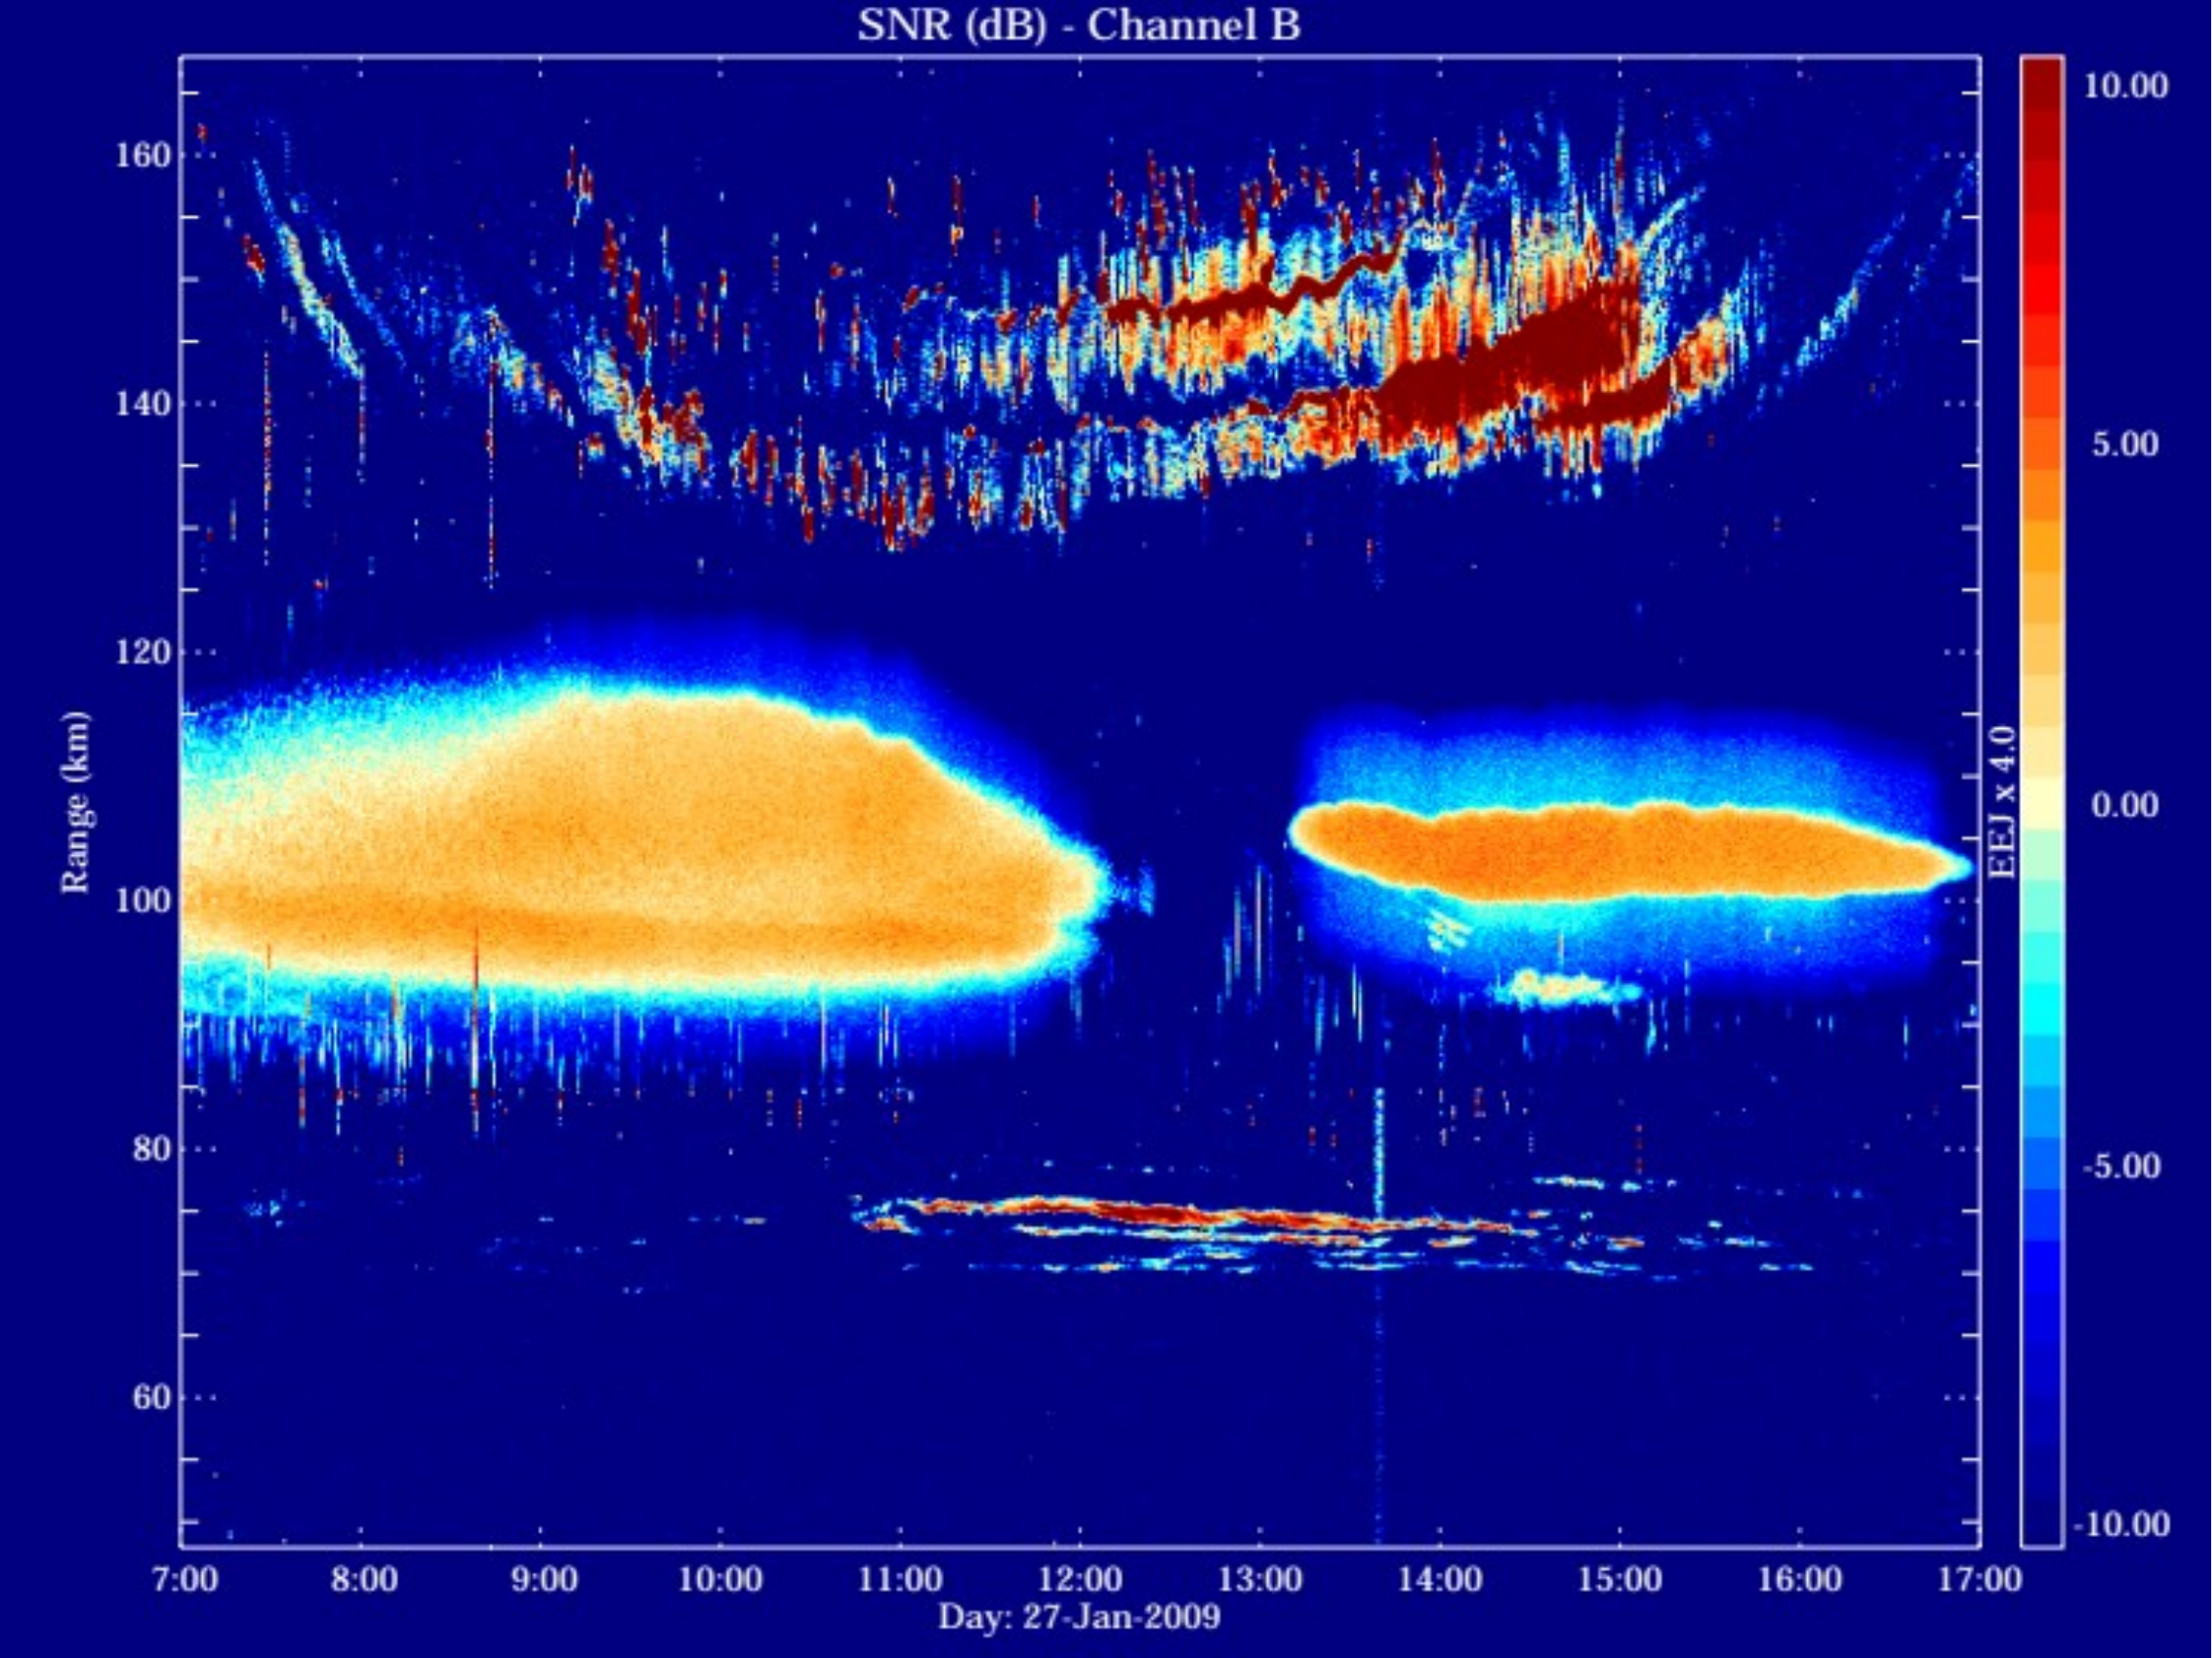
Jicamarca radar range-time-intensity plot spanning about 50 to 165 km altitude, showing 150 km echoes, the equatorial electrojet, meteor streaks, and mesospheric echoes.
A day in the lower ionosphere over Jicamarca. A single range–time–intensity plot (signal-to-noise ratio, 27 January 2009) captures almost everything JRO detects at these heights at once: the 150 km echoes in the banded structure near the top; the intense equatorial electrojet echoes filling roughly 90–120 km; individual meteor echoes as thin vertical streaks throughout this range; and mesospheric echoes in the layer at 70–80 km. Courtesy of the Jicamarca Radio Observatory and Dr. Jorge Chau.

Meteor Observations: Head and Trail Echoes

When a meteoroid ablates in the upper atmosphere it produces two distinct radar targets: a compact head echo that travels downward with the meteoroid at tens of km/s, and a longer-lived trail echo from the column of plasma left behind. High-power radars record thousands of these events, and their range–time, Doppler, and interferometric-phase signatures encode the meteoroid’s speed and the plasma physics of the trail. We work with the Jicamarca, Millstone Hill, and other radars to catalog and interpret head and trail echoes (Akharman et al. 2025), and use the Jicamarca radar’s interferometry to resolve the trails in both amplitude and phase.
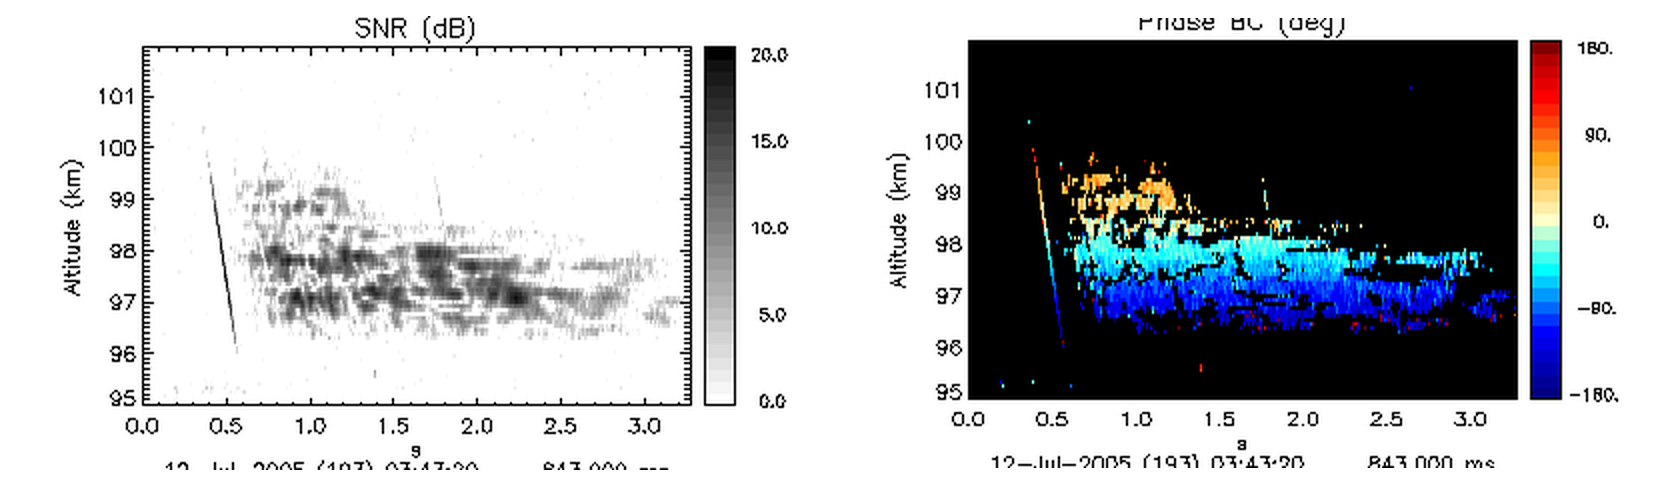
Two-panel radar plot of a non-specular meteor trail echo showing signal-to-noise ratio (amplitude) and interferometric phase versus altitude and time.
A meteor trail echo in amplitude and phase. A non-specular meteor trail echo recorded at the 50 MHz Jicamarca radar, shown as backscattered signal strength (SNR, left) and interferometric phase (right) as a function of altitude and time. The amplitude reveals the ionized trail and the field-aligned irregularities that scatter the radar signal; the phase, measured across separated antennas, pins down where within the radar beam the trail actually lies — the key to tracking the trail’s motion and turning each echo into a precise wind measurement. Jicamarca observations.

Non-Specular Meteor Trail Echoes Give High-Precision Winds

Meteor trails drift with the neutral wind, such that tracking these echoes turns each meteor into a wind sensor in the mesosphere and lower thermosphere (80–105 km), an altitude region nearly inaccessible to any other technique. Using high-resolution non-specular echoes at Jicamarca, we developed a method for measuring wind profiles with high-precision temporal and spatial resolution, revealing intense winds and sharp vertical shears (Oppenheim et al. 2009; Oppenheim et al. 2014).
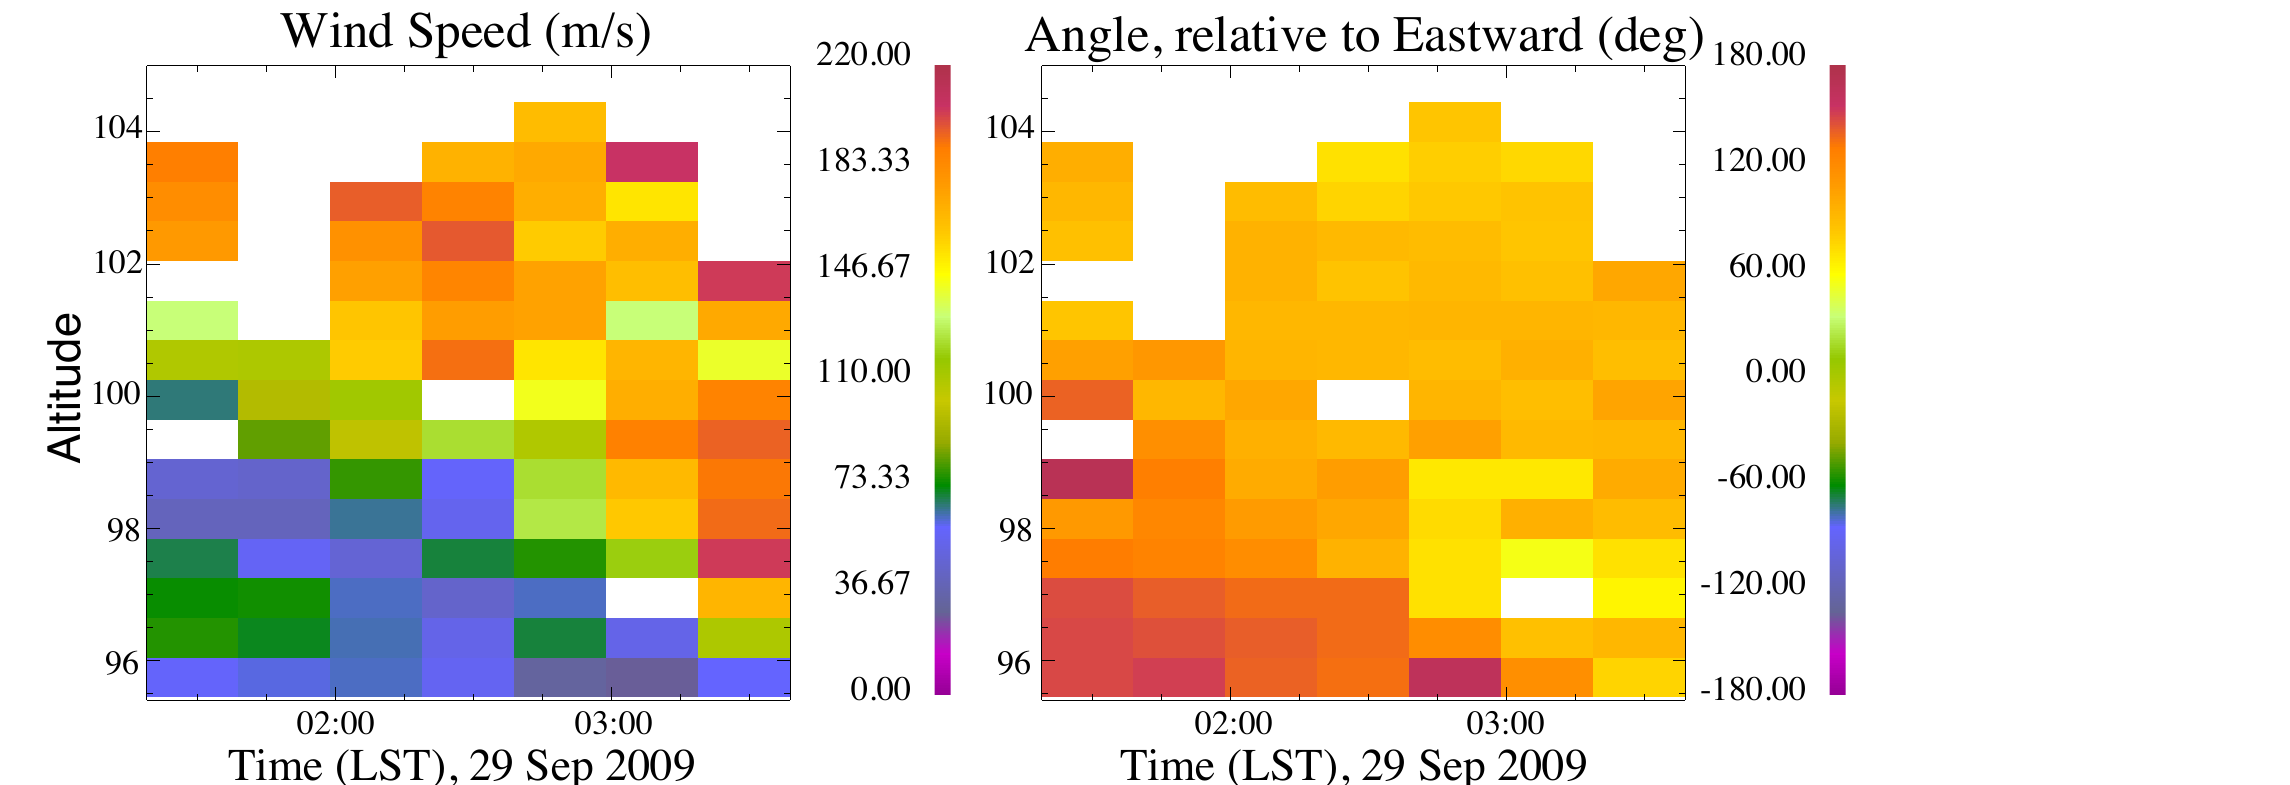
Two-panel plot of neutral wind speed and direction versus altitude and time, derived from non-specular meteor trail echoes.
Winds measured from non-specular meteor echoes. Neutral wind speed (left) and direction (right, angle relative to eastward) in the mesosphere and lower thermosphere (~96–104 km), retrieved from non-specular meteor trail echoes at Jicamarca on 29 September 2009. Most winds here exceed 150 m/s, some reaching 200 m/s, with strong shears over just a few kilometers of altitude — detail obtainable in almost no other way at these heights. From Oppenheim et al. (2014), Fig. 4.

Equatorial Electrojet Observations at Jicamarca

The equatorial electrojet is a strong current that flows along the Earth’s magnetic equator. Frequently, this current is strong enough to drive the Farley–Buneman and gradient-drift instabilities that fill the overhead sky with plasma turbulence. Because JRO looks straight up the magnetic field, it images this turbulence directly, mapping the coherent echoes in altitude and angle as they evolve through the day. These observations are the direct real-world counterpart of the 3D electrojet turbulence we simulate on supercomputers, and comparing the two is central to our ionospheric program.
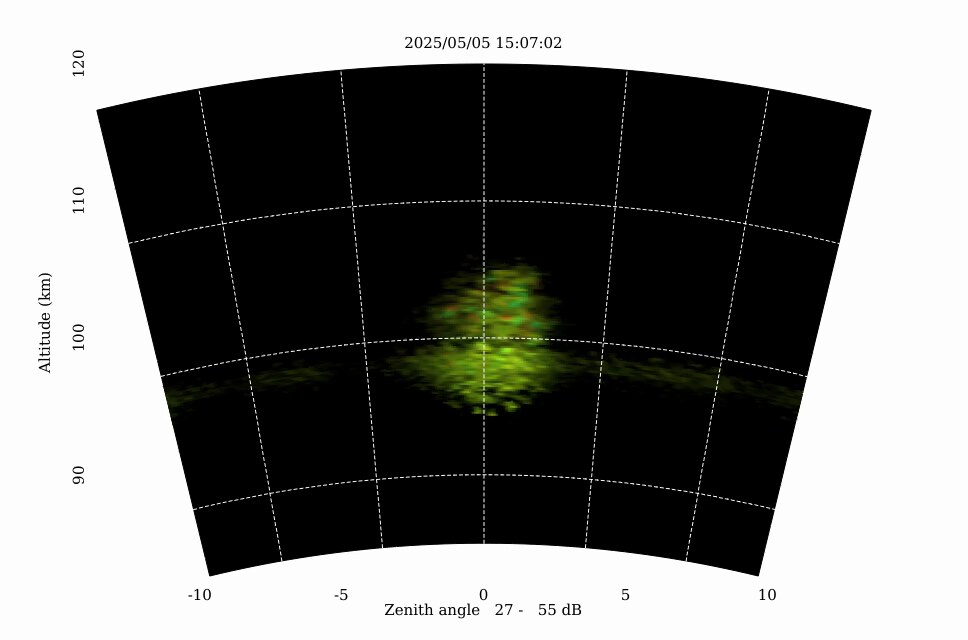
Radar image of equatorial electrojet plasma echoes over Jicamarca, plotted as altitude versus zenith angle. ▶ Play the electrojet imaging movie
Imaging equatorial electrojet turbulence over Jicamarca (May 2025). (Click to play.) Each frame maps the radar echo power from E-region plasma irregularities as a function of altitude (~90–120 km) and zenith angle. As the movie runs through the day, the coherent electrojet echoes brighten and shift in altitude, tracing the growth and evolution of Farley–Buneman turbulence in real time — the same physics captured in our kinetic simulations on the Ionosphere and Simulations pages. Observation courtesy of the Oppenheim group / Jicamarca Radio Observatory.

Auroral Precipitation and E-Region Turbulence

The same Farley–Buneman turbulence that fills the equatorial electrojet also erupts at high latitudes, wrapped around the shifting arcs of the aurora. Combining the ICEBEAR coherent-scatter radar in Saskatchewan with co-located optical auroral imaging, this work — led by Magnus Ivarsen, with our group among the collaborators — found that the small-scale E-region turbulence tends to appear just outside the bright optical arcs, driven by the strong electric fields that flank regions of auroral precipitation. It ties the microphysics of E-region instabilities directly to the large-scale structure of the aurora (Ivarsen et al. 2024).

Three panels of radar-aurora echoes overlaid on green optical aurora arcs.
Turbulence around auroral arcs. Three successive snapshots (a–c, around 05:19 UT on 13 March 2021): ICEBEAR radar-aurora echoes (colored by signal strength) overlaid on green optical aurora imaged from the ground. The Farley–Buneman turbulence hugs the edges of the optical arcs rather than their bright cores. Research led by M. Ivarsen. From Ivarsen et al. (2024), JGR: Space Physics. © American Geophysical Union.

The 150 km Echoes

For decades, radars near the magnetic equator have recorded mysterious coherent echoes from around 150 km altitude — well above the E region, where standard instability theory predicts no turbulence. Our group proposed and simulated a mechanism for them (photoelectron-driven upper-hybrid waves), and continued observations at Jicamarca and elsewhere keep refining the picture. The echoes appear in characteristic altitude bands that drift through the day, and comparing their morphology across radar frequencies is a key observational test of the theory (see the Ionosphere page for the underlying physics).
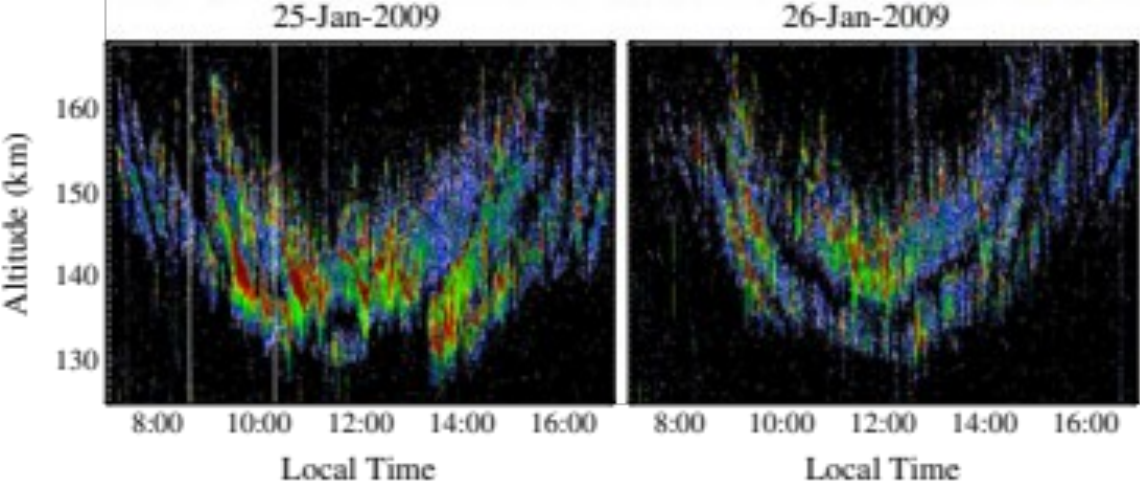
Radar altitude-versus-local-time plots of 150 km echoes at Jicamarca on two consecutive days.
150 km echoes over two days. Jicamarca radar echo strength as a function of altitude (~130–165 km) and local time on 25 and 26 January 2009. The echoes trace descending-then-ascending banded structures that recur from one day to the next — a morphology the photoelectron-driven upper-hybrid mechanism must reproduce. Jicamarca observations.
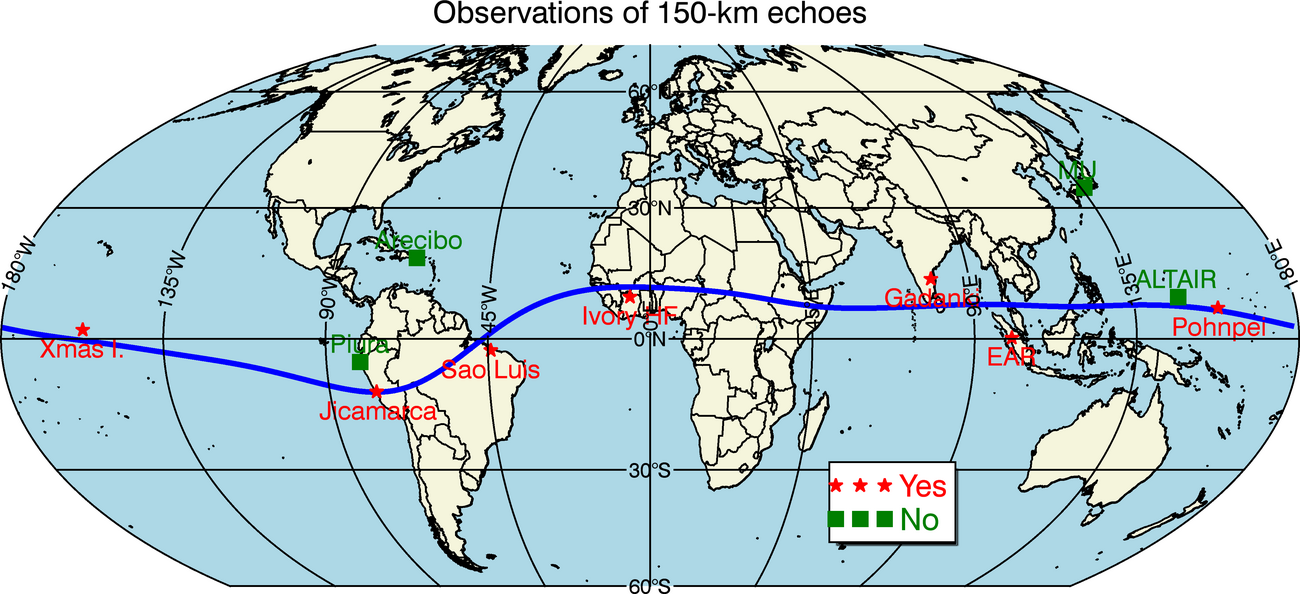
World map showing locations where 150 km echoes have and have not been observed.
Where 150 km echoes are seen. The echoes cluster tightly around the magnetic equator, marking out the geometry in which the instability operates. Compiled by the Oppenheim group.

Observations, Theory, and Simulation Together

Observations are a complementary strand of the group’s work, woven through its research on the ionosphere and meteors. The measurements shown here motivate the questions our simulations address and provide the data that test them — theory, computation, and observation advancing the same science from three directions.

Research in the group runs through the BU Astronomy PhD program: bu.edu/astronomy/graduate.

← Back to Home